


Color Signature Extraction and Regional Analysis for Artistic Imaging
Written by Leonardo Viola
Demonstrating a key component of our artwork analysis suite: the use of computer vision algorithms to extract and analyze colors within paintings, using high-quality scans. Our quantitative analysis focuses on several metrics, including the frequency of each color (a color fingerprint) and a regional analysis yielding a color palette. To illustrate our system, we identify, quantify, and visualize the color language of two paintings by Wassily Kandinsky — Romantic Landscape (1911) and Impression III (Concert) (1911) — thereby offering artistic insights.
Overview of the workflow
Let us begin by outlining the color analysis workflow, from a client’s analysis request to the delivery of an interactive report.
The client must first provide a high-resolution digital image of the painting. This is because our analysis relies on subtle indicators, patterns, or degradation signals not easily detectable by the naked eye.
In the next phase, we employ our advanced computer vision system. This system uses machine learning models and image processing algorithms to extract color information from the painting, including the *dominant colors* and *relevant colors*.
Finally, we deliver interactive reports featuring carefully crafted data visualizations that are designed to accurately and intuitively represent the data. This way, the essence of the project can be communicated to scholars, conservators, or the general public, without diving into low-level code or proprietary logic.
This color module forms an integral part of a larger suite of tools we employ for a multi-faceted understanding of artworks. Importantly, all the modules we have developed ensure that our analysis is consistent and reproducible, removing subjective biases often inherent in qualitative assessments.
Note also that we have designed a cloud-native system architecture featuring an automated workflow to achieve efficient performance. It features scalable processing layers, designed to handle large datasets, and is modular, maintaining adaptability to various content types or client-specific requirements. Consequently, we anticipate running a detailed analysis over thousands of artworks within a museum database, requiring only minor additional technical work.
Overview of the artworks
This paper illustrates the results of the workflow described above, using works by Wassily Kandinsky (1866-1944), a prominent Russian painter and art theorist. More precisely, we will focus on two paintings from 1911: *Romantic Landscape*, an abstract piece that retains some recognizable elements of a landscape and features a vibrant color palette and dynamic brushwork; and *Impression III (Concert)*, a highly energetic work whose colors and forms aim to express the music of Arnold Schoenberg (1874-1951).
Although they formally predate the conventional founding of the Bauhaus movement in 1919, they arguably laid the groundwork and took crucial early steps, pioneering abstraction and the emotional use of color and form, a concept Kandinsky himself elaborated upon (Kandinsky, 1911).
Color analyses
In this section, we will present the main color analyses we perform on an artwork and how they help us to understand its color language.
Global Color Fingerprint
The most direct information we can extract from raw pixels is the global color fingerprint. In its simplest form, this fingerprint consists of a count, for each color in the RGB space, of the number of pixels with that color within the image, regardless of their physical location on the canvas. In practice, however, we first normalize brightness and contrast to ensure meaningful results.
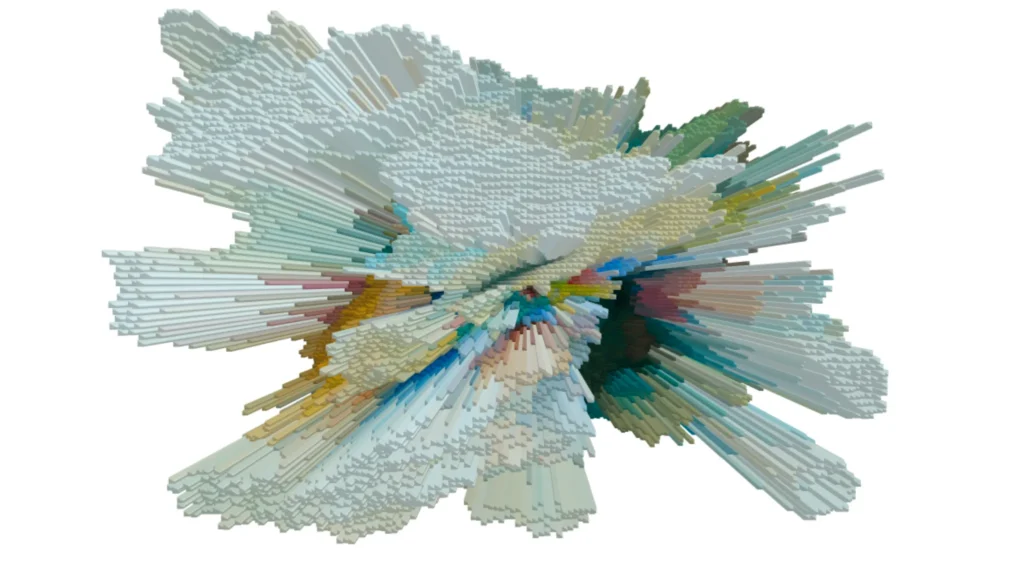
In the reports we produce, we visualize this information in two ways: a 3D plot showing, for each color channel (red, green, and blue), the distribution of color intensity; and, what we call the *color gem*: the smallest 3D convex shape containing all the colors present in the artwork. In addition, in the interactive report, the user can rotate the axes to gain a better intuitive feel for the precise colors used in the painting.
When examining the intensity distributions for *Romantic Landscape*, its bimodal nature immediately becomes apparent. We observe two primary intensity peaks, occurring around 40 and 190 (on a 0 to 255 scale), which correspond to dark regions against an otherwise light sky. This pattern also appears if we analyse other paintings by the master, such as *Impression III (Concert)* (1911) or *Black Spot* (1921), Suggesting a recurring compositional strategy related to his exploration of light and shadow, he famously used black not as an absence of color, but as a color in its own right.
Vasilij Kandinsky – Romantic Landscape – Scatter Plot
### **Adaptive Palette Mapping**
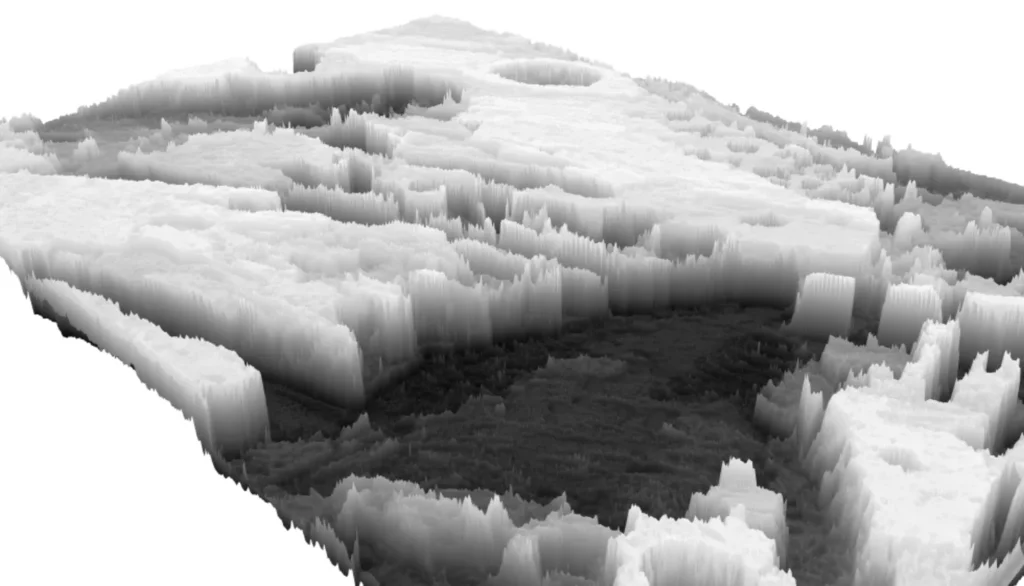
The second analysis begins by dividing the image into tens of thousands of equal-size squares. Crucially, this step requires that the digitalization we are working with has a sufficiently high resolution. It then records the average color present in each square, and similar tones are blended into a concise palette, a process related to color quantization techniques (Heckbert, 1982).
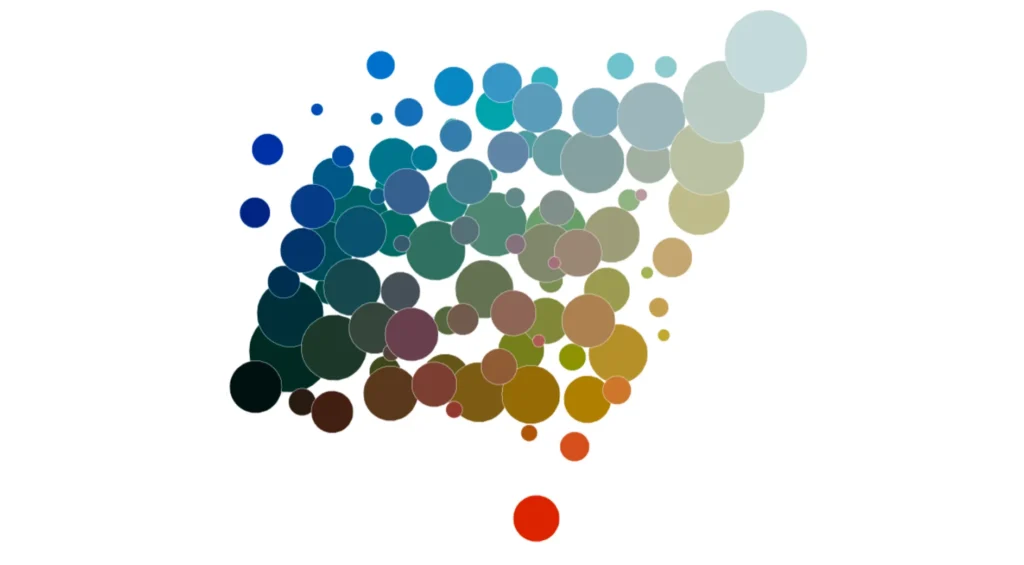
We offer a 3D representation where the axes correspond to the three color channels of the picture and where each color in the palette is represented by a sphere. The size of each sphere corresponds to the importance of the color, but, with the intention of providing a meaningful representation, this correspondence is logarithmic rather than linear. This allows for a better appreciation of the relative importance of the colors in the artwork, reflecting principles of color interaction discussed by theorists like Itten (1970).
Thus, in *Impression III (Concert)*, the palette we extract features blues, cyans, and reds prominently, even though half the canvas is painted in his signature yellow.
Vasilij Kandinsky – Romantic Landscape – Zenital Extraction
Dominant Region Detection
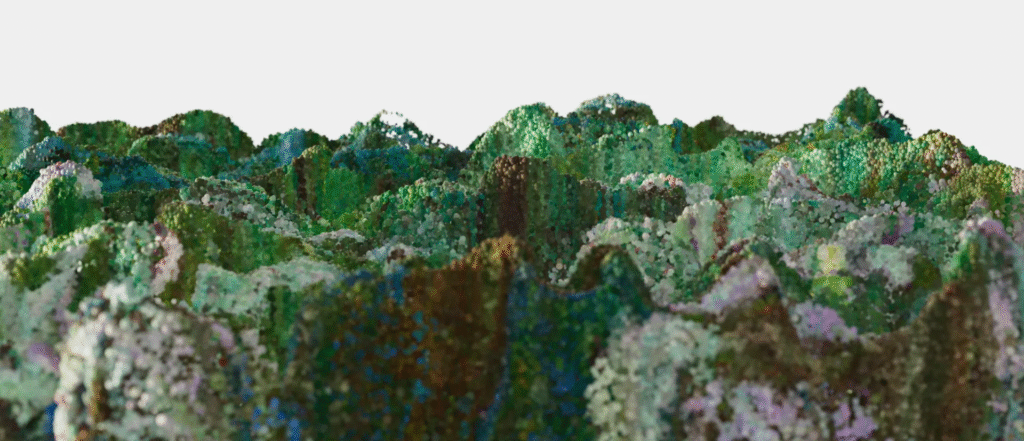
Third, we strive to reveal the color landmarks that define an artwork’s compositional emphasis and atmosphere. This is achieved by delineating the region associated with each key hue.
More precisely, disregarding color intensity (see the previous section for intensity analysis), we identify a number of key hues (pure spectrum colors). We then determine the largest continuous swaths of each key hue using an algorithm similar to Connected-Component Labeling (CCL) (Shapiro and Stockman, 2001).
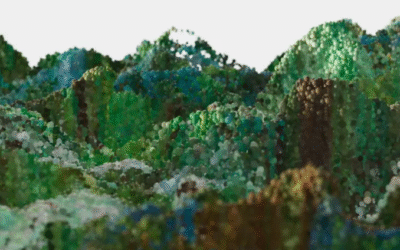
We observe that certain regions of the sky in Kandinsky’s *Romantic Landscape*, particularly those around the orange solar orb, are not merely brighter; rather, they exhibit a color different from the rest of the sky, containing hues of blue and tending towards white.
Vasilij Kandinsky – Romantic Landscape – Surface Plot
Relevant Color Highlighting
While the previous examples accurately overview the colors most frequent by pixel count in an image, and thus its compositional structure, they fall short of identifying spotlighting accents that guide the viewer’s eye. This is particularly true for elements like the aforementioned sun in *Romantic Landscape*, whose significance is not simply a matter of the region’s size, but also of its visual contrast with the surrounding context.
When representing these focal points, the painting is reproduced as a desaturated canvas, except for these areas, which are thereby visually isolated and spotlighted.
Conclusion
Using two Kandinsky paintings, for which we possess high-resolution and faithful digitalizations, we have demonstrated how our advanced color analysis system provides valuable artistic insights into both composition and focal points. These insights are delivered to the user in digestible forms like color palettes, spatial dominance maps, and interactive 3D plots.
We believe this work, a foundational module of our atwork analysis suite, will be of use to many, most notably:
- Scholars in digital humanities, who can explore the chromatic structure of an artwork and quantify stylistic evolution across an artist’s œuvre, potentially uncovering subtle influences or shifts in artistic periods.
- Art conservators, who can track pigment degradation by analyzing sequential scans or detect potential overpainting by comparing image data. These precise, reproducible markers can then provide supporting evidence in the authentication of artworks.
- The general public, who can gain intuitive understanding of the color story of paintings using, for example, interactive kiosks as part of a museum’s education mission.
Moreover, the systematic nature of this analysis facilitates the creation of searchable databases where chromatic features can be queried.
References
Heckbert, P. (1982) ‘Color image quantization for frame buffer display’, ACM SIGGRAPH Computer Graphics, 16(3), pp. 297-307.
Itten, J. (1970) The Elements of Color. New York: Van Nostrand Reinhold.
Kandinsky, W. (1911) Concerning the Spiritual in Art. Translated by M. T. H. Sadler, 1977. New York: Dover Publications.
Shapiro, L. G. and Stockman, G. C. (2001) Computer Vision. Upper Saddle River, NJ: Prentice Hall.
Related Posts:
Quantumspace – Building the Infrastructure of the Visual Economy
This article will introduce you to QuantumSpace's Vision as a growing Company in a challenging market. Discover how we face the challenges in multiple areas of research, spearheading developments in the fields of Quantum and AI.
QuantumSpace – Towards a new phenomenology of the digitized artwork
We present you QuantumSpace, with a selection of excerpts and quotes from our C.E.O. Alberto Finadri and our C.O.O. Francesco Rocchi. Discover how we shaped our unique solutions, spearheading developments in the field of AI.
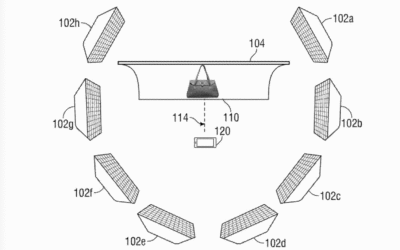
USPTO Patent US-20250272995-A1
Discover the foundation of our innovation in Patent US-20250272995-A1, which serves as the cornerstone of our core technology. This patent outlines the proprietary mechanisms and methods that drive our unique solutions.