


About QuantumSpace
Welcome to the History of QuantumSpace, a guide through the pivotal milestones and concepts shaping this Company’s development. From early 21st-century theories to today’s innovations, explore the evolution of Quantum Data Analysis. Delve into the Company’s research verticals, from Arts and Culture to Automotive and Fashion.

QuantumSpace Art
The Dawn QuantumSpace
QuantumSpace is founded in Desenzano del Garda, Italy, with the vision of turning visual signals into structured data.
First Vertical: Art
Launch of QuantumSpace art project, focused on authentication, classification, and restoration support through image diagnostics.
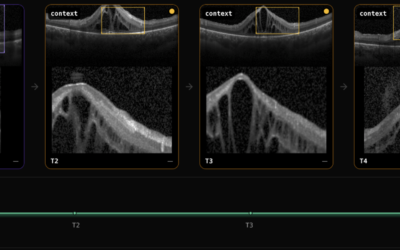
Zenital Analysis of Monet's Water Lilies
Credit: QuantumSpace AI
Strategic Expansion to New York
Backed by NextTech VC and supported by Pier59 Studios, QuantumSpace relocates its headquarters to New York City.
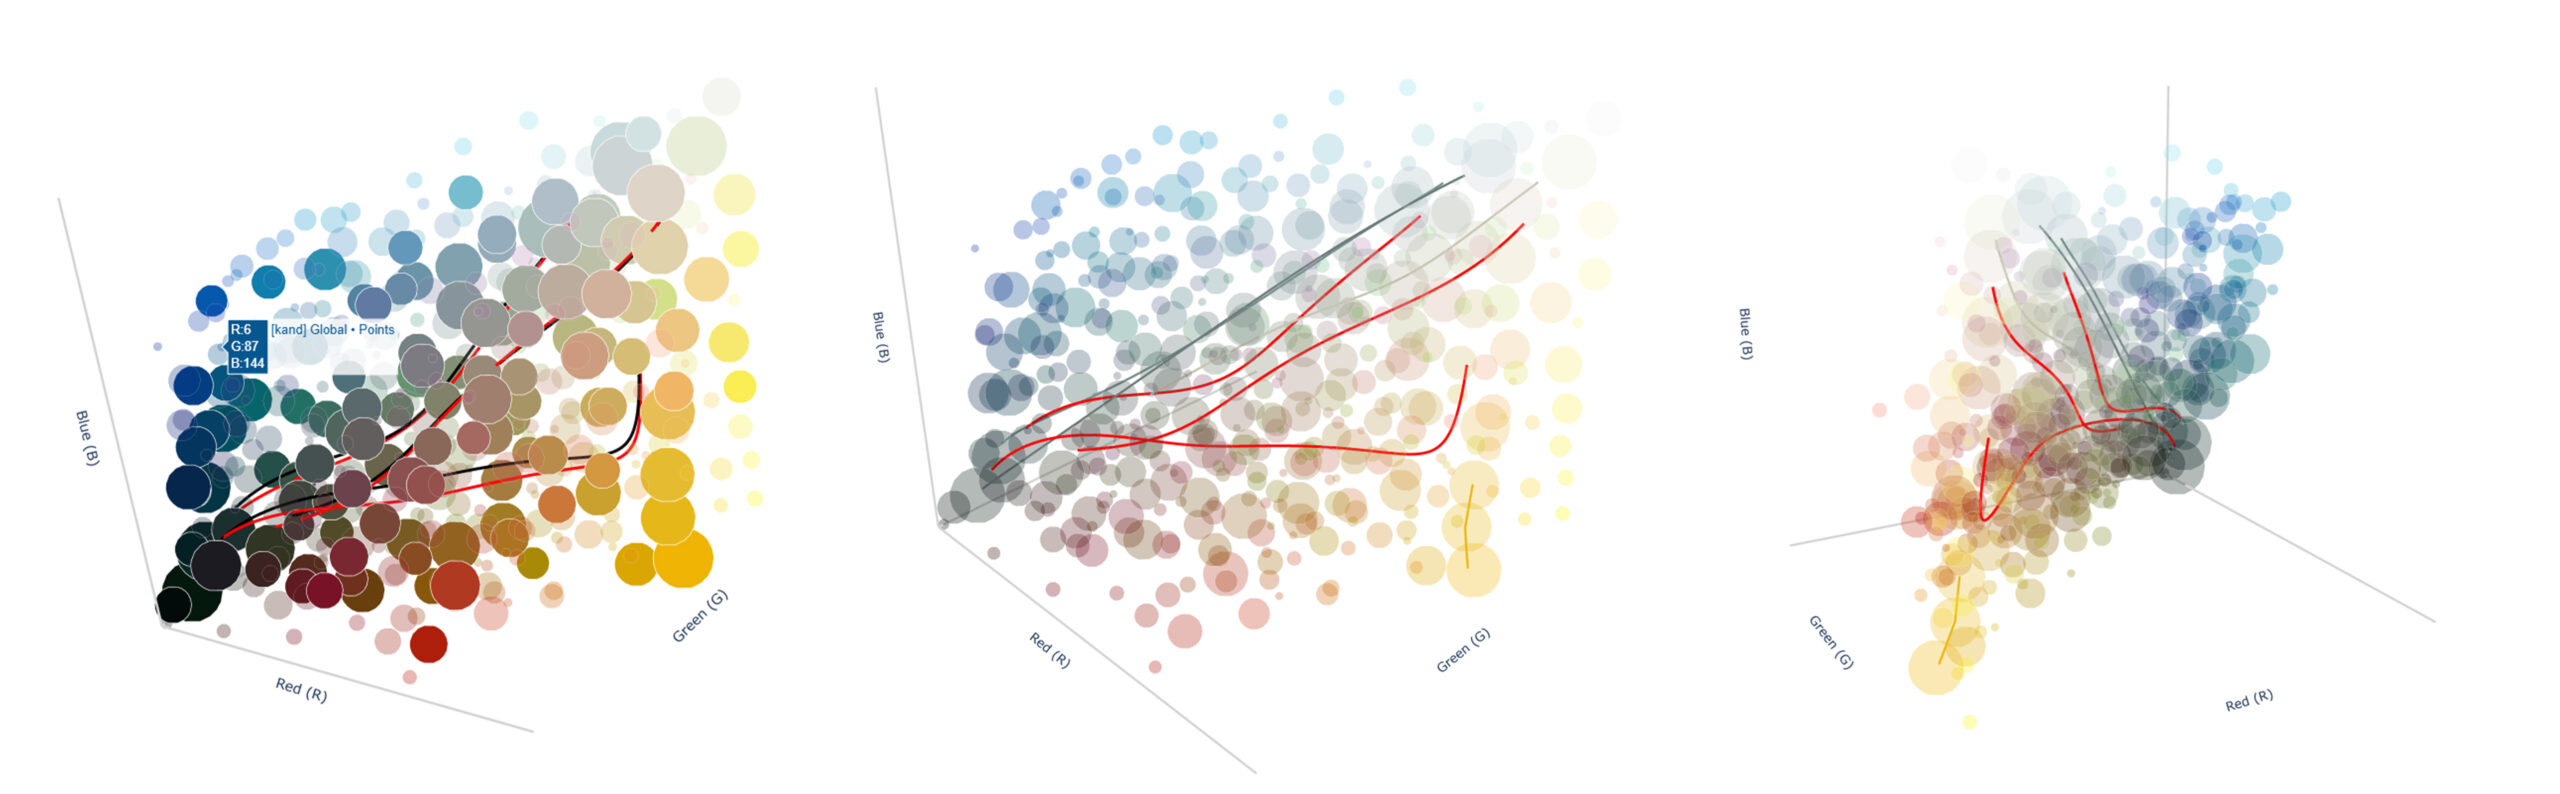
Scatter Plot Analysis of Vassily Kandinsky's Impression III Concert
Credit: QuantumSpace AI
Industry Diversification
Expansion into automotive (defect detection & component analysis) and marble & natural materials (surface classification from images).
Academic Partnerships
Initiation of collaborations with international universities and research centers to strengthen the scientific foundation of our technology.
Key Terms
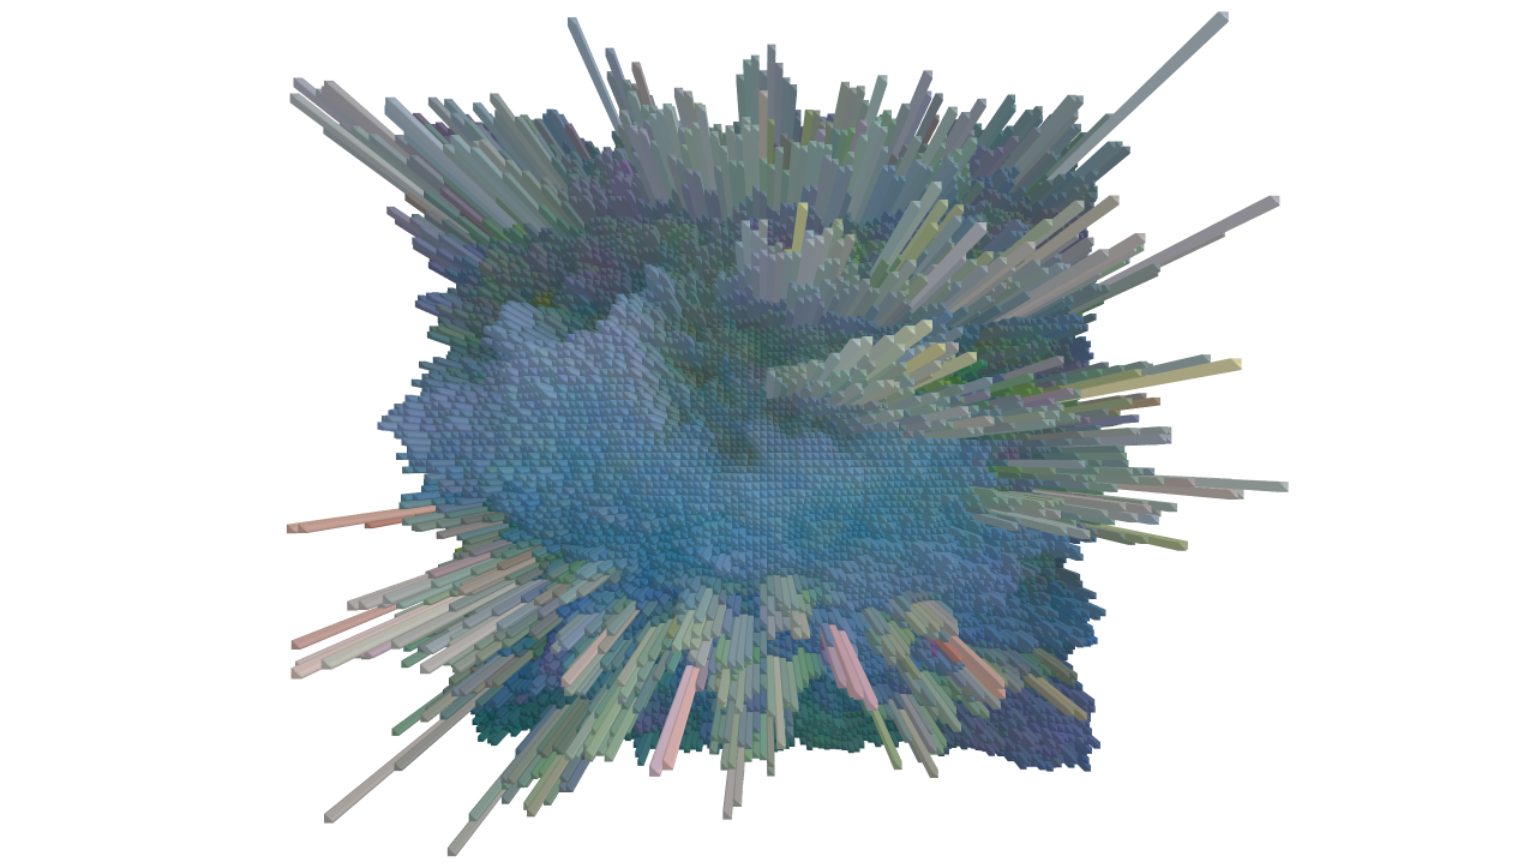
Zenital
The software performs a Three-Dimensional Color Volumetric Extraction. This technology enhances standard brightness extraction by incorporating color data into the topographical representation of each image. The advanced technique generates a detailed three-dimensional “color sculpture” for both, where each block’s position corresponds to specific areas, with heights representing brightness values (0-255) and surfaces displaying the actual colors.
Scatter Plot
The three-dimensional plot enables a comparative analysis of how colors are distributed across the RGB axes in both images, highlighting similarities and differences in their chromatic composition By plotting the red, green, and blue values against each other, the scatter plot reveals clusters that indicate dominant color trends and transitions. Areas with high concentrations of points suggest prevalent color combinations, while sparse regions indicate less common or unique hues.